
What Low PPO Reimbursement Is Doing to Your Practice Value

Here is the conversation I have had more times than any other, and it never starts with insurance.
An owner tells me production was the best it has ever been. Full schedule, team held together, an extra day of hygiene.
Then he says the part that actually brought him to the call. His take-home was flat, maybe down.
He has usually already been told this is a management problem. Tighten supplies.
Watch payroll. Check your collections percentage.
Some of that is fair. But when I open the numbers, a large share of the gap sits in one place, and it is not overhead.
It is the difference between what the practice charged and what it was allowed to keep, and that gap has widened quietly for years while everyone watched the expense side.
So let me do this properly. What is happening to reimbursement, how to measure your own position, what can genuinely be fixed, and what all of it does to the number a buyer eventually puts on your practice.
Key takeaways
- Reimbursement is not falling — it is standing still while costs rise. ADA Health Policy Institute reporting has rates flat and trailing inflation, and 55% of dentists named insurance their top concern for 2026.
- Most owners cannot state their write-off rate by plan. A blended adjustment figure tells you nothing. You need the discount, the collections and the chair-hours each plan consumes.
- Some of this is negotiable; some is contract hygiene. Leased networks, non-covered-services rules and stale fee schedules are all fixable without dropping a single plan.
- Dropping plans is not automatically right. Around a third of dentists say they are likely to leave certain networks; far fewer do, usually because volume and new-patient flow win.
- Payer mix is a direct valuation input, not a footnote. A buyer underwrites the fee schedule you are locked into, so identical collections can be worth materially different amounts.
What does low PPO reimbursement do to my practice’s value? It lowers the earnings a buyer underwrites and it raises the risk they price.
Buyers pay a multiple of adjusted EBITDA, and heavy discounting suppresses that number directly. Concentrated dependence on one poorly paying plan also narrows the pool of buyers willing to bid.
One definition first, because the term gets used loosely. A PPO is a preferred provider organization contract — you accept a discounted fee schedule in exchange for being listed in-network and put in front of that plan’s members.
What is actually happening to dental reimbursement?
The frustrating part is that almost nothing dramatic has happened. There was no year where rates were slashed.
Reimbursement simply stopped moving while everything on your expense line kept moving. ADA Health Policy Institute reporting through late 2025 describes provider reimbursement as flat and trailing both general inflation and practice expenses.
That is the whole mechanism. A flat top line against a rising cost base shrinks the margin, with no single event to point at.
The profession has noticed. In an ADA Health Policy Institute poll at the end of 2025, insurance issues — low reimbursement, delayed or denied payments — were the leading concern named for 2026, cited by 55% of responding dentists.
That is not a fringe complaint. It outranked staffing, which tells you something given how bad hiring has been.
The market data underneath the frustration
Look one level up and it gets clearer. The money flowing into dentistry is growing more slowly than the money flowing into the rest of health care.
National dental expenditures reached about $189 billion in 2024, roughly 3.6% of total health spending, growing around 4% year over year against 4.6% for health care overall.
Split it by payer and the trend is sharper. Between 2023 and 2024, private dental insurance spending rose about 2.3%, out-of-pocket spending about 3.3%, and government program spending roughly 9%.
Private insurance — the source of most of your PPO income — is the slowest-growing pool in the mix.
Premiums tell the same story from the carrier side. National Association of Dental Plans reporting has dental premiums rising well below the Consumer Price Index for a run of consecutive years, the average increase recently under 1%.
A plan holding premiums flat is doing what its purchasers asked for, and that is not bad faith. It does have a consequence downstream.
Premium dollars that do not grow cannot fund allowed fees that do.
The coverage pool has shrunk slightly too. Around 284 million Americans — roughly 83% of the population — held some form of dental benefit in recent NADP reporting, down about 2.3% year over year.
Plan design drifted the same way, which the ADA tracks in its benefit-trends materials. Annual maximums have barely moved across decades of dental inflation, so a benefit that once covered most of a treatment plan now covers a fraction of one.
| What moved | Direction | Why it matters to you |
|---|---|---|
| Contracted PPO fee schedules | Flat in nominal terms, down in real terms | Your allowed fee buys less staff time each year |
| Practice expenses (staff, supplies, lab) | Up, faster than reimbursement | The gap lands on your margin |
| Dental premiums | Rising well below inflation | Limits the pool funding allowed fees |
| Dental benefit enrollment | Slightly down year over year | Fewer covered patients per market |
| Government dental spending | Up, fastest of the three | Growth sits where rates are lowest |
The bottom row deserves a moment. Medicaid fee-for-service reimbursement sits below 50% of what dentists charge, and below 60% of private reimbursement, in most states per ADA Health Policy Institute analysis.
So the fastest-growing payer source is also the thinnest. That is not an argument against seeing those patients — it is an argument for knowing what share of your chair time they occupy.
One more number, because it changes your options. Roughly one third of dentists reported not being busy enough in early 2026, and consumer spending on dental services grew about 24% over the past decade against 48% for physician services.
The standard advice — drop the bad plans, backfill with better patients — assumes a queue of patients waiting. In a lot of markets there is not.
How do I measure my own reimbursement position?
Most owners can quote their collections and overhead percentages. Very few can tell me what any single plan pays them per hour of chair time, which is the only number that decides anything.
Start by submitting your full fee on every claim. This is the ADA’s own first piece of guidance, and it exists for a mechanical reason.
If your software submits the contracted fee instead, the write-off never appears anywhere. You cannot manage a discount you never record.
Then build three views, all of which come out of your practice management software.
Your effective write-off rate, by plan. Total office fee submitted for that plan, minus total allowed, divided by total submitted. Run it over twelve months, not a quarter.
Production and collections, by payer. Total production is what you charged. Adjusted production is what you charged minus contractual write-offs.
Collections is what actually arrived.
The distance between those three columns, plan by plan, is the real story of your practice.
Yield per chair hour, by plan. This is the one that changes minds. Take collections attributable to each plan and divide by the operatory hours that plan consumed.
Two plans with similar write-off rates can produce very different hourly yields — one sends patients who need restorative work, the other sends patients who come twice a year for a cleaning.
| Metric to build | How to calculate it | What it tells you |
|---|---|---|
| Effective write-off rate | (submitted − allowed) ÷ submitted, per plan, 12 months | The true discount, not the contract summary |
| Adjusted production by payer | Production minus contractual adjustments, per plan | What you earned the right to collect |
| Collection rate by payer | Collections ÷ adjusted production, per plan | Whether a plan pays slowly, partially, or after appeal |
| Yield per chair hour | Collections ÷ operatory hours consumed, per plan | The only ranking that supports a decision |
| Share of collections, top plan | That plan’s collections ÷ total collections | Concentration risk, which buyers price |
Then narrow it. The ADA’s guidance is to evaluate your top 20 procedures by payer rather than the whole code set.
That is the difference between a project you finish and one you abandon in March. A small number of codes drives most of the revenue, and those are the ones worth arguing about.
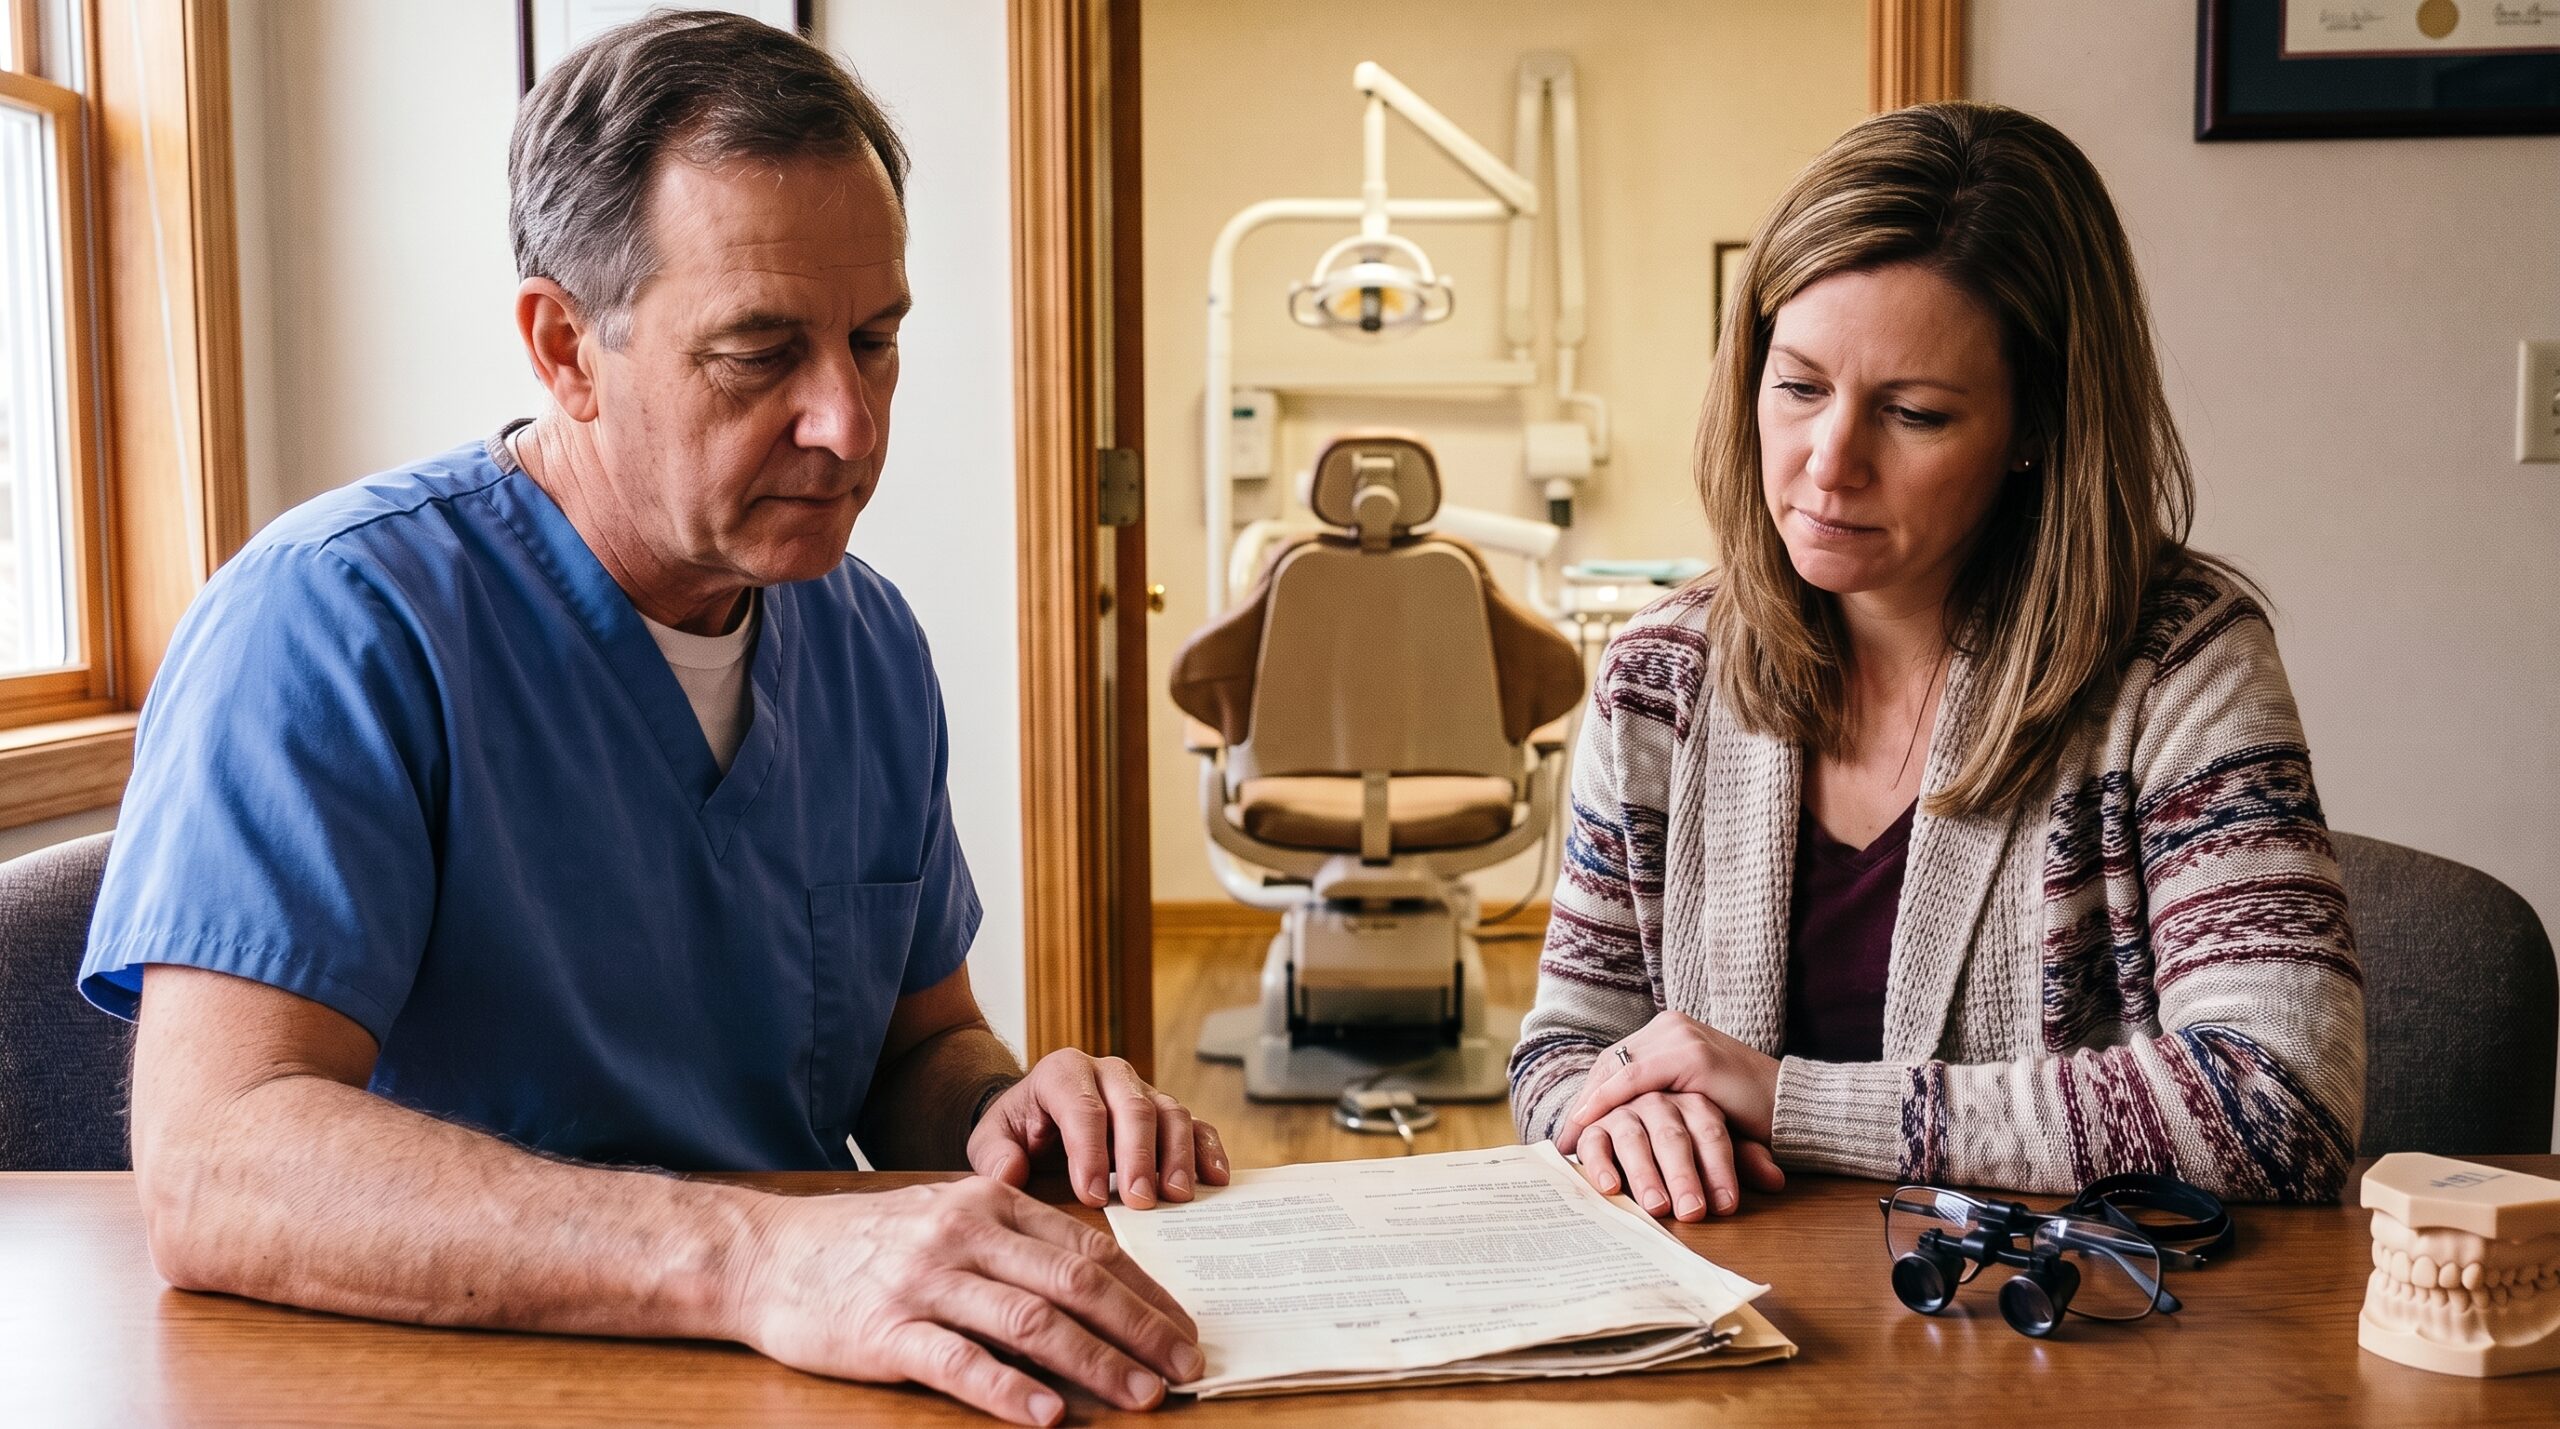
What can actually be fixed inside the practice
Now the useful part. Four moves, roughly in order of how often they work.
Renegotiate, one payer at a time
Owners assume contracted fee schedules are fixed. Plenty are not, and the ADA’s own guidance is to review contracts periodically and negotiate individually.
One piece of context explains a lot of confusion: the ADA cannot negotiate rates for individual dentists, because federal antitrust rules prevent it. So the negotiation is yours to run, which is exactly why so few owners run it.
Take one payer, not five. Pick the plan where your write-off rate is worst relative to the chair time it consumes.
Come with your top 20 codes, your submitted-versus-allowed history, and what you are asking on each. Request the review in writing.
Realistic outcomes: partial improvement on some codes, a tier change, or nothing. All three beat not asking, because the third one is data.
I have watched owners get a real lift on a handful of high-volume codes simply by being the only practice in the region that asked with numbers attached.
Audit your leased networks
This one surprises people, and it is worth an afternoon. Networks get leased.
You sign with one carrier, that carrier leases its network to another payer or administrator, and claims arrive from plans you have never heard of, paying at your discounted schedule.
The ADA publishes guidance on this. It goes by third-party access, network leasing, affiliations or umbrella networks, and dentists routinely end up in-network with plans they never signed with.
Pull every participation agreement and find the third-party access clause. Then ask each carrier, in writing, for the current list of entities your fee schedule is leased to.
Regulation is moving in your favour — roughly 30 states have now passed legislation on third-party contract leasing.
Colorado’s law, signed in April 2026 and effective that August, is among the most far-reaching: affirmative consent before a network is leased, regular disclosure of who holds the leased schedule, and no cancelling a dentist who declines.
In an opt-in state, that audit is not academic. There may be discounts you can decline.
Fix your fee-schedule hygiene
Two items, both money left on a table.
Non-covered services. Forty-four states have laws preventing a plan from dictating your fee for a procedure the plan genuinely does not cover. Six states do not: South Carolina, Delaware, New York, Michigan, Massachusetts and Hawaii.
The trap is in the definition. In most states a service counts as covered based on benefit eligibility, not on whether a claim actually got paid.
So a crown that goes unpaid because the annual maximum is exhausted, the deductible is unmet, or a frequency limit was hit is still a covered service, and the contracted fee still applies.
A genuinely non-covered service is one the plan excludes outright — cosmetic veneers under a plan that excludes cosmetics. Those are the ones the law protects.
One caveat catches people: these state laws generally reach fully insured plans, while self-funded employer plans may claim exemption.
Your own fee schedule. If office fees have not moved in three years, your write-off percentage looks better than it is, and every percentage-of-fee arrangement is anchored to a stale number. Review them annually.
Know what the legislation is doing
More is happening here than most owners realise, and some of it will move your economics without you lifting a finger.
37 dental insurance reform laws passed across 18 states in 2025, up from 16 laws in 9 states the year before, out of more than 120 bills filed. The momentum carried into the 2026 sessions.
The themes are concrete: dental loss ratio, assignment of benefits, virtual credit card opt-outs, credentialing timelines, and rules on artificial intelligence in claim adjudication.
Dental loss ratio is the one to watch — it requires a plan to spend a defined share of premium on patient care rather than administration and margin.
Montana, North Dakota and Washington enacted versions in 2025. Washington’s sets an 85% threshold, a rate filing below it is presumptively disapproved as excessive, and the state publishes insurer-level ratios.
Federally, the DOC Access Act has been reintroduced. It would bar plans from setting fees for services they do not cover, and cap contracts at two years without the dentist’s consent.
None of this pays you this quarter. All of it is worth ten minutes a year, because your state association’s advocacy is one of the few levers that scales beyond your practice.
The honest case for staying in network
I would be doing you a disservice if I only made one side of this argument, so here is the other one properly.
Around a third of dentists tell ADA Health Policy Institute surveys they are very or somewhat likely to drop participation in certain PPO networks. A far smaller share actually does it.
That gap is the most interesting number in this article. Dentists follow through on most of their stated plans; network drops are the notable exception, and it is not weakness — it is owners running the arithmetic and concluding volume matters more than the discount.
New-patient flow. For many practices the plan directory is the largest single source of new patients. Leaving does not just cost you the existing panel — it turns off the tap that replaces natural attrition.
Attrition is worse than the model. Owners assume 20% of a plan’s patients leave and 80% stay and pay. Model it the other way and see whether the practice still works.
Out-of-network is harder than it looks. Plans reduce direct payment to non-participating dentists, apply lower allowables, and frequently apply higher deductibles and reduced annual maximums to patients who go out of network.
There is an administrative cost too. Plans often will not share allowable fees with a non-participating office, there is no industry standard for setting them, and the same procedure under two employer groups can pay very differently.
Your front desk absorbs that — verifying benefits, estimating against your full fee, explaining balances nobody expected. The ADA’s guidance here is unglamorous and right: a written financial policy, reviewed with every patient, pretreatment estimates as standard.
My honest position. Drop the plan whose yield per chair hour is genuinely below what you could replace it with, and only after modelling a bad attrition case and surviving it.
Do not drop a plan because a seminar said so. And do not drop three at once a year before you want to sell — which brings us to what a buyer sees.

How a buyer reads your payer mix
Here is where the operational problem becomes a valuation problem, and it is more direct than most owners expect.
Scale context first. The Association of Dental Support Organizations counts more than 80 member companies supporting over 8,500 practices across 48 states, and Becker’s Dental Review has reported 69% of DSOs expecting to increase acquisitions in 2026.
A DSO is a dental support organization — the management company that owns the non-clinical side of a practice and handles everything outside the operatory, while a licensed dentist keeps the clinical entity.
That is a large, well-advised pool of buyers, and every one of them models your fee schedule before almost anything else.
Buyers do not pay for production. They pay a multiple of adjusted EBITDA — what the practice earns in pure operating profit after paying a market-rate dentist to do the work you currently do yourself.
Every dollar of contractual write-off is a dollar that never reaches that number. Your fee schedule is not a billing detail.
It is an input to the price.
The full bridge from collections to adjusted EBITDA to a price sits in our guide to what a dental practice is actually worth, and the multiple side in our piece on dental practice EBITDA multiples.
I will not re-derive either here. What matters is what the payer schedule specifically does to the underwriting.
Buyers underwrite the schedule, not the production. A diligence team models the contracted rates that will exist after closing. Your goodwill with a plan does not transfer.
The contracted fee does.
Concentration is priced as risk. A practice where one poorly paying plan drives a large share of collections has a single point of failure. If that plan re-tiers, narrows its network, or a state Medicaid programme changes, the whole model moves.
Government-payer exposure is assessed state by state now. Trade reporting from DrBicuspid describes buyers dropping a single national rule and weighing Medicaid concentration against each state’s policy direction.
The examples are recent. California has the end of Proposition 56 supplemental payments and an adult Denti-Cal rollback deferred to July 2027, while Texas approved roughly $140 million to raise Medicaid dental reimbursement.
Identical Medicaid shares in those two states do not carry identical risk, and buyers no longer pretend otherwise. Reimbursement exposure now sits alongside single-producer reliance and softening trailing performance as a named reason deals get restructured or abandoned.
| What the buyer looks at | Reads well | Reads badly |
|---|---|---|
| Share of collections from the largest plan | Spread across several plans | One plan dominating the book |
| Government-payer share | Modest, in a state with stable policy | Heavy, where rates are under review |
| Fee schedules | Reviewed in the last 12–24 months, with dates | Untouched since signing |
| Write-off rate trend | Flat or improving over three years | Widening, unexplained |
| Non-covered-services handling | Documented, consistent with state law | Contracted fees applied to excluded services |
| Leased-network exposure | Audited, with a current holder list | Unknown |
Fix that last row first if you are anywhere near a sale. It is cheap, and “we don’t know” is the worst answer in a diligence call.
And here is the encouraging part. Unlike most valuation drivers, this one is partly in your hands.
You cannot change your practice’s size before you sell. You can change whether the fee schedules were reviewed, whether leased-network exposure is documented, and whether top-plan concentration has come down.
A practice that presents that work is not just worth more arithmetically. It reads as well run, and that changes the tone of everything after.
Why this is a 12 to 24 month project, not a pre-sale fix
Buyers price the trailing twelve months. Not the plan, not the explanation, not last quarter’s improvement.
Every move above takes time to reach numbers a diligence team will credit. A renegotiated schedule needs several quarters of claims behind it.
A dropped plan needs a full cycle to show its real attrition.
Which produces an uncomfortable rule. Payer-mix work started twelve months out reads as disruption. Started twenty-four months out, it reads as improvement.
Started three months out, it reads as a red flag, because a sudden change in payer composition is exactly what diligence teams are trained to interrogate.
So sequence it properly. Our guide to preparing a dental practice for sale sets out the runway, and payer mix belongs early in it.
If you are not selling for a decade, none of this is wasted. You spend ten years keeping more of what you produce.
What I would actually do next
Pick one week. Pull twelve months of submitted-versus-allowed by plan, and the chair hours each plan consumed.
Rank them by yield per hour.
Then write down your largest plan by collections and what share of the practice it represents. That is the number a buyer will ask for, and most owners have to go and look it up.
Then choose one payer and ask for a review. Not five.
One.
One last thing about the value side, and it has nothing to do with insurance. What an owner gets depends less on which buyer they choose than on how many are seriously competing at once.
That is what the Elite Selling System exists to create. We screen and hand-pick every group allowed to bid, much as a good venue decides at the door who gets through the rope, then run a private competitive window inside that group.
If you want to know where a cleaned-up payer schedule would put you, that starts with a free, confidential practice value estimate — and quite often ends with us telling an owner to spend two years on exactly this work first.
Our fee is entirely success-based, so we have no reason to push anyone toward a transaction that is not right for them.
Frequently asked questions
Does low PPO reimbursement lower what my dental practice is worth?
Yes, in two ways. Contractual write-offs reduce adjusted EBITDA, the number a buyer applies a multiple to, so the price effect is arithmetic.
Separately, heavy dependence on one poorly paying plan reads as concentration risk, which narrows the pool of buyers willing to bid confidently.
Can I actually negotiate a PPO fee schedule?
Often, though not always successfully. The ADA advises members to review contracts periodically and negotiate individually; it cannot bargain for you because of federal antitrust rules.
Approach one payer at a time, with your top 20 procedures and twelve months of submitted-versus-allowed data attached.
What is network leasing and why does it matter to me?
It is when a carrier leases its network — and your discounted fee schedule — to another payer or administrator. You can end up in-network with plans you never signed with.
Roughly 30 states now regulate this, and several require your affirmative consent first.
Should I drop my worst-paying dental plan?
Only after modelling it honestly. Rank plans by collections per chair hour rather than write-off percentage, then test a bad attrition case rather than a gentle one.
Many owners run this and correctly stay, because volume and new-patient flow outweigh the discount.
How do I calculate my real write-off rate?
Submit your full office fee on every claim so the discount gets recorded, then take submitted fees minus allowed fees, divided by submitted fees, per plan, over twelve months. A blended adjustment figure across all payers hides the exact differences you need.
Are dental reimbursement rates actually falling?
Mostly they are flat rather than falling, which produces the same result more quietly. ADA Health Policy Institute reporting has rates trailing both inflation and practice expenses, so an unchanged allowed fee buys less staff time, supplies and lab work each year.
Will insurance reform laws improve my reimbursement?
Not directly or quickly. The 37 laws passed across 18 states in 2025 mostly address transparency, payment practices, credentialing and dental loss ratio rather than setting rates.
Dental loss ratio rules are the likeliest to affect economics over time.
How long before a sale should I fix my payer mix?
Allow 24 months if you can, and treat 12 as the minimum. Buyers price trailing results, so a renegotiated schedule or dropped plan needs several quarters of claims behind it.
Changes made shortly before market read as disruption, not improvement.
Sources
Reimbursement conditions and dentist sentiment
- ADA Health Policy Institute. “The State of the U.S. Dental Economy, Q1 2026 Update.” ada.org
- ADA Health Policy Institute. “The State of the U.S. Dental Economy, Q4 2025 Update.” ada.org
- ADA News. “Dear ADA: Reimbursement rates.” January 2026. adanews.ada.org
The dental care market and who pays for it
- ADA Health Policy Institute. “National dental expenditures, 2024.” ada.org
- National Association of Dental Plans. “Statistical Reports.” nadp.org
- National Association of Dental Plans. “Provider, patient benefits rose; dental plan enrollment fell in 2024.” May 2026. globenewswire.com
- American Dental Association. “Dental Benefit Trends.” ada.org
- ADA Health Policy Institute. “Medicaid Fee-For-Service Reimbursement Rates.” ada.org
Contracts, networks and fee schedules
- American Dental Association. “PPO (Network) Leasing.” ada.org
- ADA News. “Dear ADA: I’m being paid as a network provider, but I never signed an agreement with that plan. What happened?” September 2025. adanews.ada.org
- ADA News. “Colorado enacts dental insurance reform targeting network leasing practices.” April 2026. adanews.ada.org
- ADA News. “Dear ADA: Noncovered services.” March 2026. adanews.ada.org
- ADA News. “Dear ADA: Out-of-network providers.” November 2025. adanews.ada.org
Legislation and regulation
- ADA News. “37 dental insurance reform laws passed in 2025.” October 2025. adanews.ada.org
- ADA News. “State dental insurance reforms continue momentum in 2026 legislative sessions.” July 2026. adanews.ada.org
- ADA News. “Dental loss ratio: Putting patient care first.” April 2025. adanews.ada.org
- Washington State Office of the Insurance Commissioner. “Washington State Insurers Dental Loss Ratios (2025–Present).” data.wa.gov
- Congress.gov. “H.R.1521 — DOC Access Act of 2025.” congress.gov
Buyer behaviour and practice values
- DrBicuspid. “Dental practice values hold, but these shifts are changing who sells and for how much.” drbicuspid.com
- Becker’s Dental Review. “69% of DSOs plan to boost acquisitions in 2026: Report.” beckersdental.com
- Association of Dental Support Organizations. “About ADSO.” theadso.org

Melani Seymour, co-founder of Transitions Elite, helps veterinary practice owners take action now to maximize value and secure their future.
With over 15 years of experience guiding thousands of owners, she knows exactly what it takes to achieve the best outcome.